
Use metrics in a workbook
Metrics are custom aggregate calculations that you can reuse across workbook data elements that share the same data source: a dataset or a connection table. Define metrics at the level of the data source, and apply them to workbooks to ensure consistent metric logic across tables, visualizations, and pivot tables.
This document explains how to use metrics in a workbook to perform standard calculations with ease and efficiency. For more information about metrics in datasets or connection tables, and on how to create, edit, and delete these metrics, see Create and manage metrics.
Requirements
To use metrics in workbooks, you must have the following access:
- Your account type must have the Explore Workbook or Edit Workbook permissions.
- You must be the workbook owner, or have the Can Explore/Can Edit workbook permissions.
View metric details
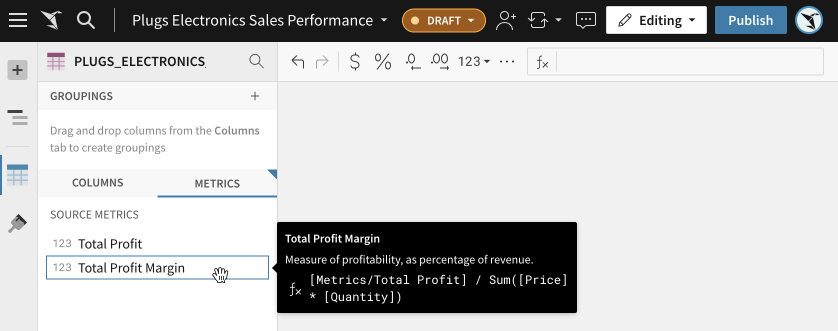
- In a workbook, you can view available metrics of a data element in the Element properties > Metrics tab.
- Hover over any metric to see its description and formula.
- Metrics are specific to an element's data source. All defined metrics appear in the Metrics tab. To create new metrics, see Create a metric.
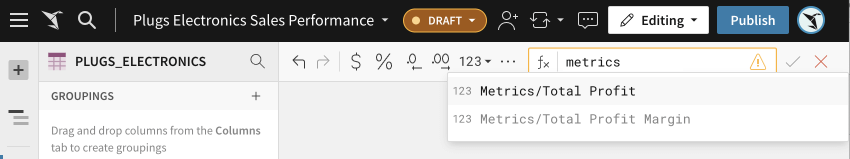
- Metric suggestions also appear in the formula bar. Simply type the name of the metric, and Sigma auto-completes it for you. To find which metrics are in the system already, type "metrics", and scroll through the available options. Descriptions of the metrics appear as you scroll through the menu.
Add metrics to data elements
You can add metrics to many workbook data elements by either dragging metrics onto the correct area in the configuration sidebar, or by using the Add functionality (the plus icon,  ).
).
Metrics in calculations of a grouping level
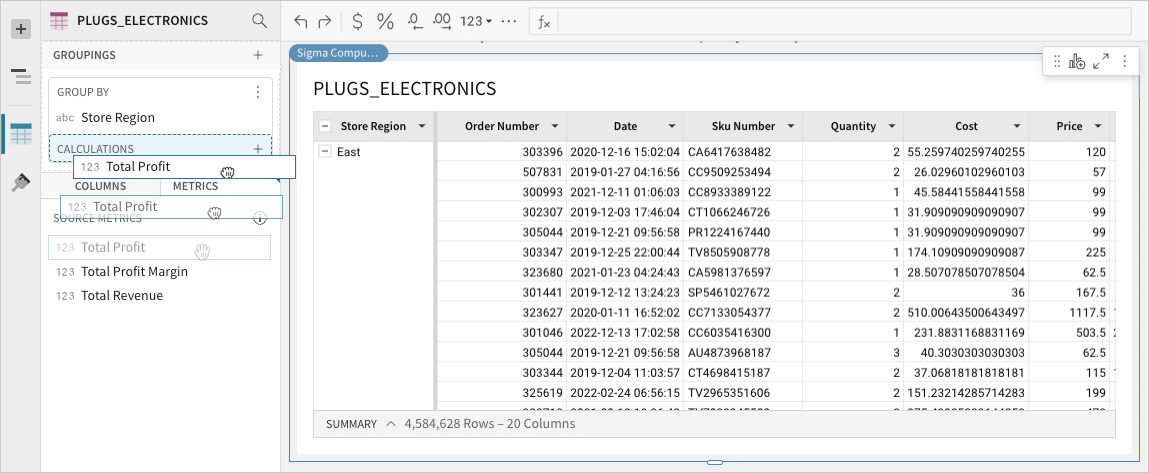
You can add metrics to calculations of the grouping by dragging the metric:
- Under the Groupings header, ensure that you have at least one grouping.
- Click on the metric, and drag it into the Calculations area.
Alternatively, add the metric in the element itself:
- Under the Groupings header, ensure that you have at least one grouping.
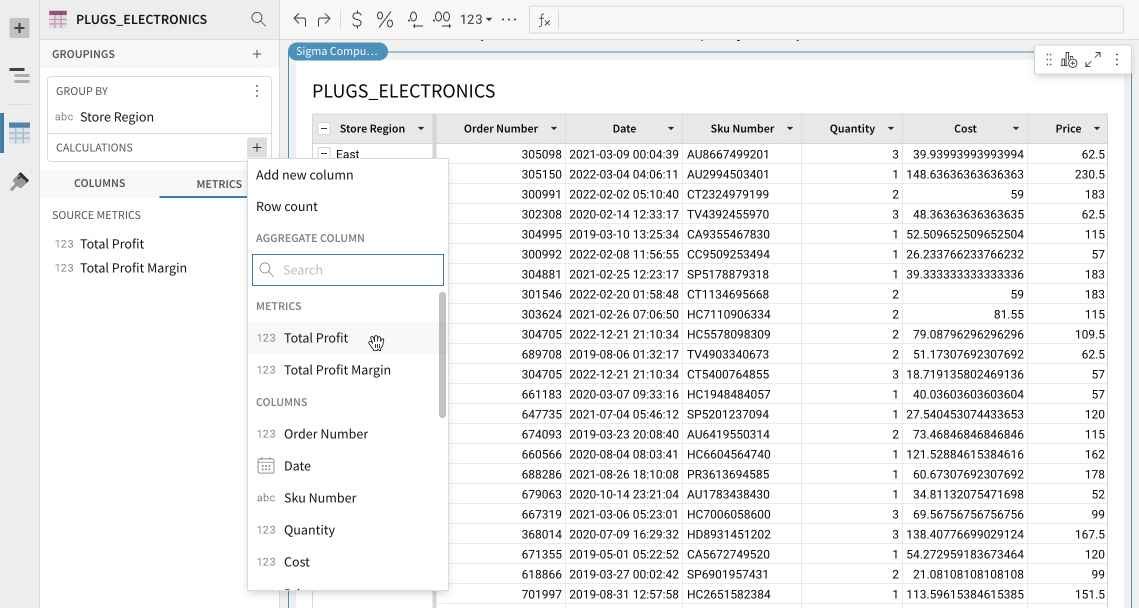
- In the Calculations area, click the plus icon,
 .
. - In the drop-down menu, select the metric. The menu groups the metrics, so you can find them easier.
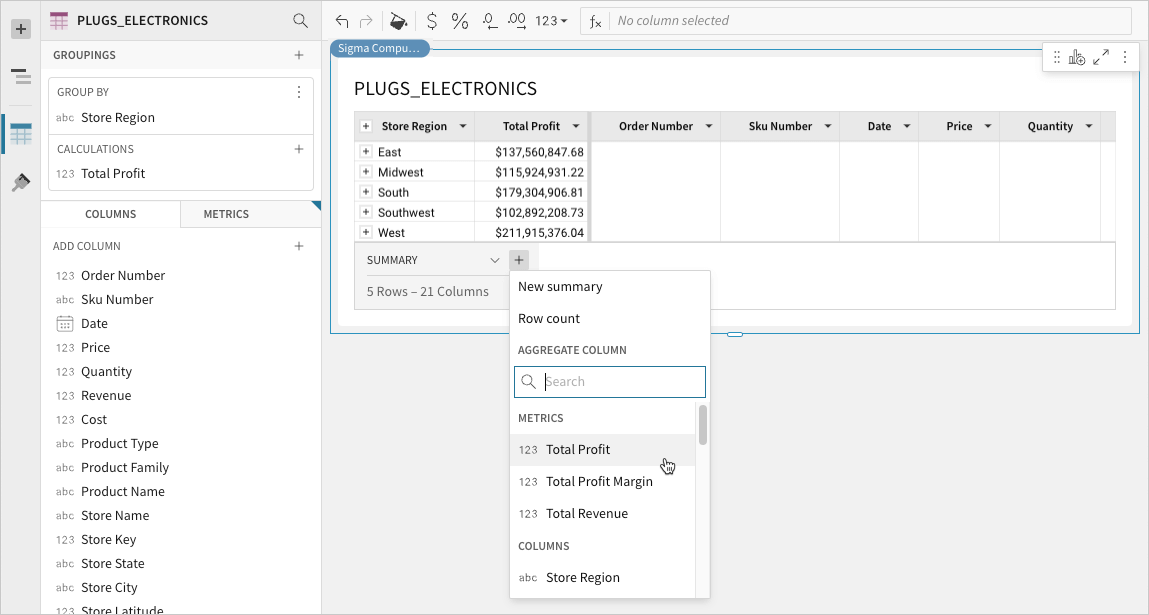
Metrics in the summary bar
To add a metric to the summary of a table, follow these steps:
- Click
 (plus/new icon).
 - In the menu, under the Metrics header, select the metric to aggregate the grouping.
Metrics in visualizations
In many visualization types, you can place a metric on the value axis; typically, this is the Y-axis. In other visualizations, the metrics can specify the color scale, main KPI parameters, tooltips, and others. Here, we demonstrate how to add metrics to the value axis and tooltips.
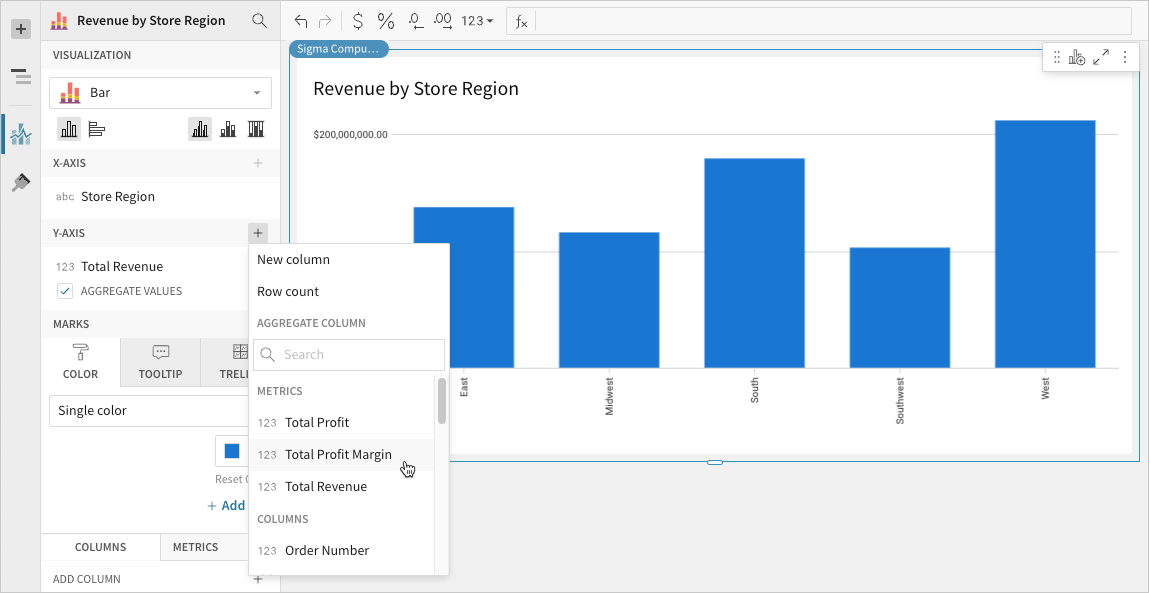
Value
To add a metric to the value axis of the visualization, you can drag the metric from the Metrics tab into the axis specification area.
Alternatively, follow these steps:
- Click
 (plus/new icon) next to the name of the axis. Typically, this is the Y-axis.
 - In the menu, under the Metrics header, select the metric.
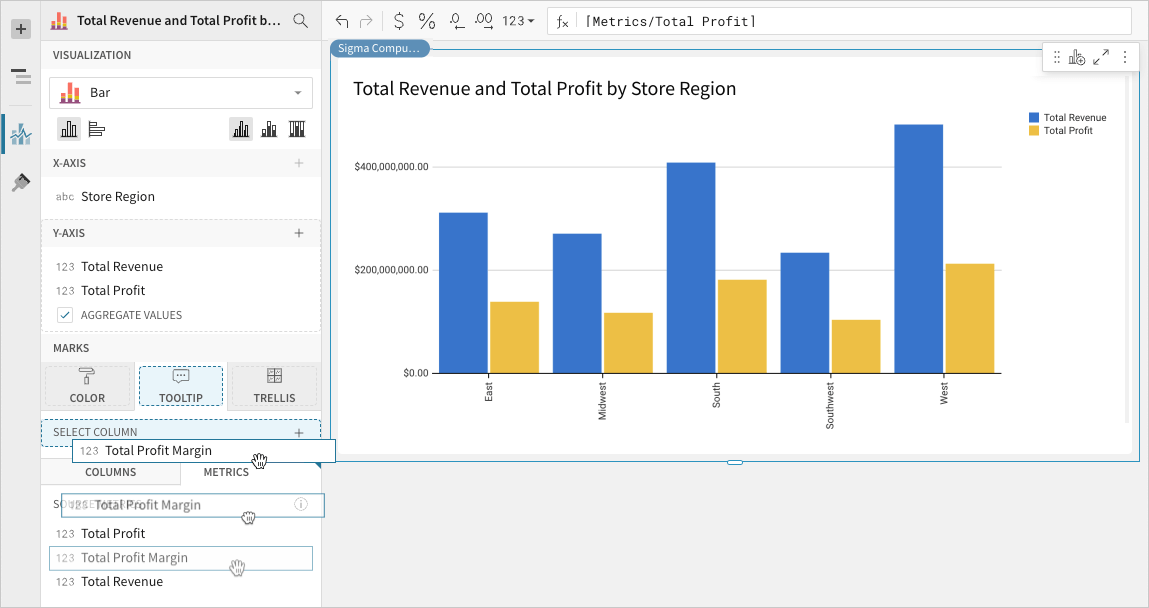
Tooltip
To add a metric to the visualization's tooltip, follow these steps:
- Under the Marks options, select the Tooltip tab.
- Click Metrics.
- Choose the metric from the list, and drag it to the Select column area.
Alternatively, click the plus icon,  , in the Select column area, and choose the metric from the drop-down menu.
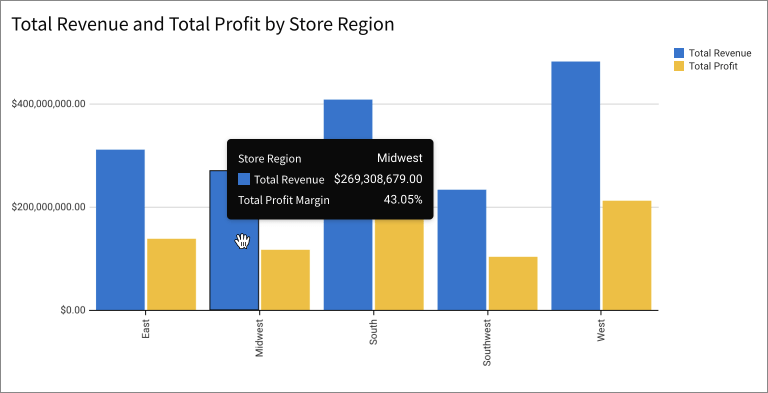
When you hover over the visualization element, the tooltip appears. Notice that it contains the metric you added.
Metrics in pivot tables
In pivot tables, you can add metrics to the Values area.
Add the metric by dragging it from the Metrics table to the Values area:
- Select the Metrics tab.
- Find and select the metric.
- Drag the metrics into the Values area of the pivot table specification.
Alternatively, click the plus icon,  , in the Values area, and select the metric from the drop-down menu.
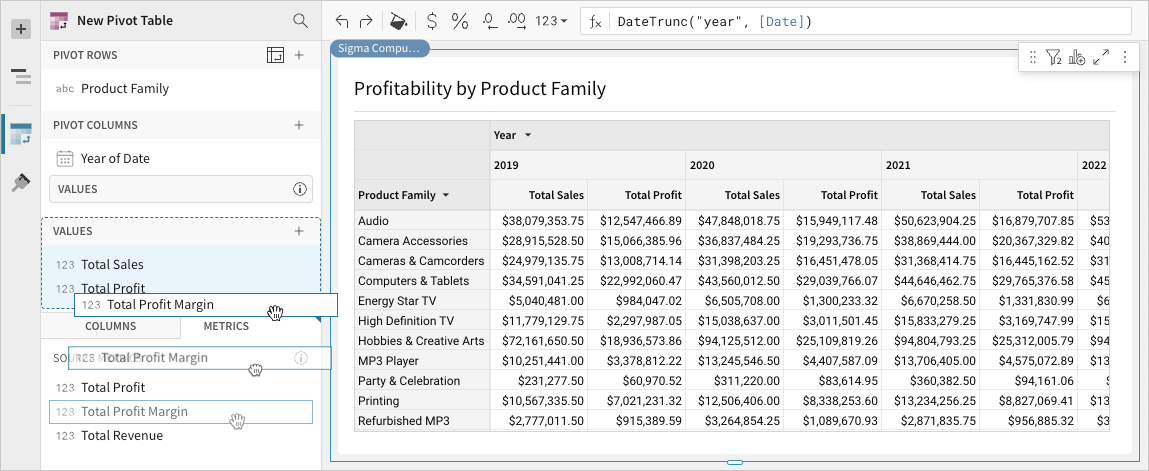
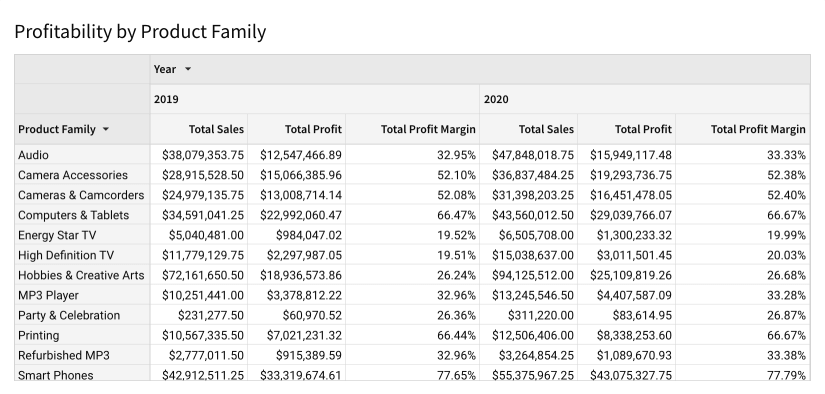
Notice that the new metric appears in the pivot table.
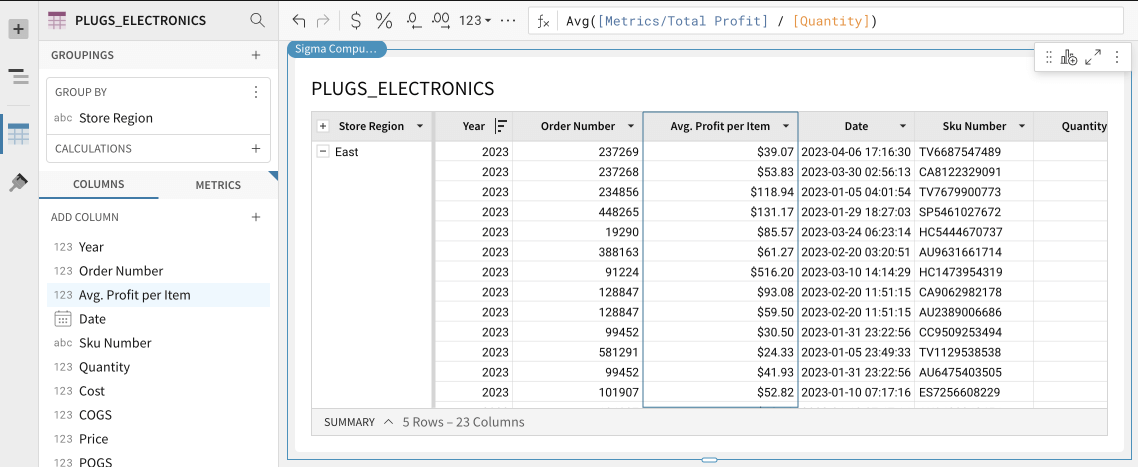
Metrics in the formula bar
You can use metrics as part of a calculated formula for a new column.
Updated 5 months ago